HomeAnalytics & Reports
Documentation · OperationsOne dashboard, not six exports.
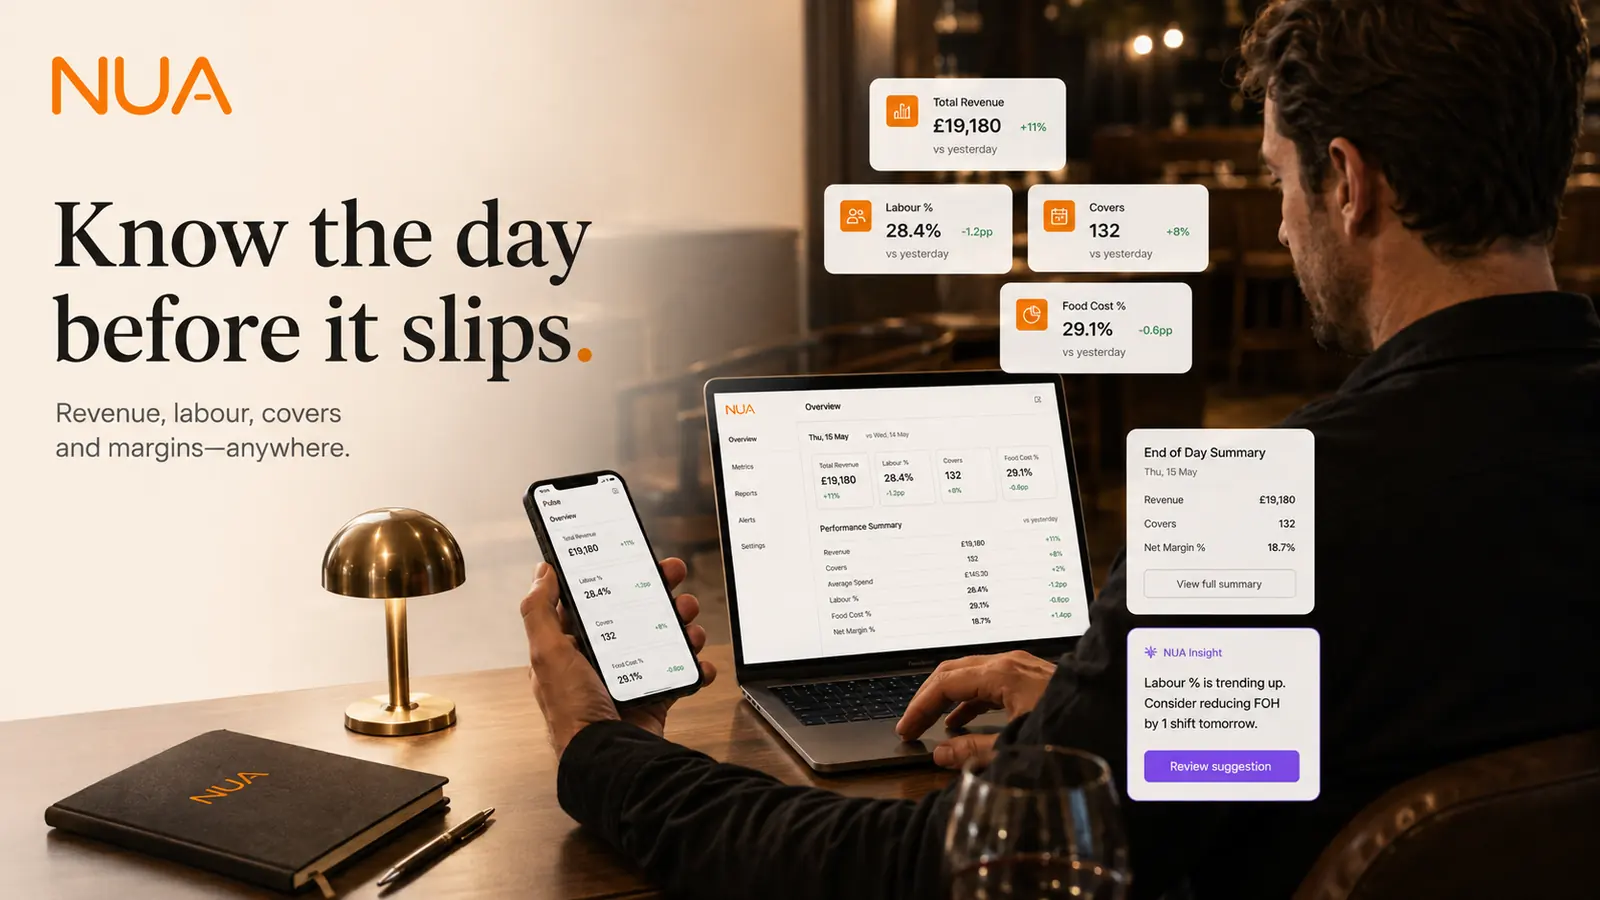
Sales, labour, inventory and loyalty data unified into one reporting layer.
Analytics & Reports setup guide
Estimated setup time: 10 min
Before you start
- At least one other module (POS, Inventory, Staff or Loyalty) already running
Setup steps
- 1
Confirm data sources
Check Analytics → Sources to see which modules are already feeding the dashboard — more connected modules means richer reports.
- 2
Set your reporting periods
Choose default comparison windows (week-on-week, same period last year) under Analytics → Settings.
- 3
Build your first dashboard view
Start from a template (Revenue, Labour Cost, Menu Performance) under Analytics → Dashboards, or build a custom one.
- 4
Schedule automated reports
Set up a daily or weekly summary to email to managers under Analytics → Scheduled Reports.
- 5
Set alert thresholds
Configure alerts for metrics you want flagged automatically (e.g. food cost % above target) under Analytics → Alerts.
Tips
- The more modules connected, the more useful this gets — Analytics is a view over other modules' data, not a separate data entry point.
- Scheduled reports are the easiest way to keep a multi-location team aligned without anyone logging in daily.
- Menu Performance is usually the most actionable starting template: it shows which items are quietly losing money.
Troubleshooting
- A report looks incomplete or missing data.Check Analytics → Sources — a report can only include modules that are connected and have been running long enough to have data.
- Scheduled report emails aren't arriving.Confirm recipient addresses under Analytics → Scheduled Reports and check spam/junk on the first send.
Related modules
Still stuck on analytics & reports setup?
Email us directly, a real person on the team replies.